How to use the Browser Inspector to troubleshoot CSS and JavaScript issues in your WordPress Theme
The browser inspector is the most powerful tool in any web developer’s arsenal for diagnosing problems on your website. It shows you source code like HTML, as well as any CSS and Javascript that’s been applied to an element of your page.
While you can’t update your website permanently from the inspector, this tool is useful for spotting and troubleshooting issues, making changes in live time, and viewing those changes on your screen.
Accessing the Browser Inspector
You can use the Inspector tool in any browser. Here’s how to access it from the more common website browsers.
Google Chrome
In GOOGLE CHROME, right-click an element on the page (specifically, right click the element that is giving you problems) and select Inspect to jump into the Elements panel.
It should pop up in a window at the bottom or side of your browser and look like this:
Firefox
In FIREFOX, you can also right-click and choose Inspect Element, or you can go to Tools > Web Developer > Toggle Tools.
Safari
Finally, if you’re using SAFARI, again the right-click > Inspect Element pathway works. Alternatively, you can go to the Develop menu.
If you don’t see the Develop menu in the menu bar, choose Safari > Preferences, and click Advanced, then select Show Develop menu in menu bar. Once you see the Develop menu, go to Develop > Show Web Inspector.
Using the inspector to troubleshoot bugs
Once the web inspector is open, the difficult task of bug fixing begins.
If an element on your website is misbehaving or not styled how you want it, inspect that element.
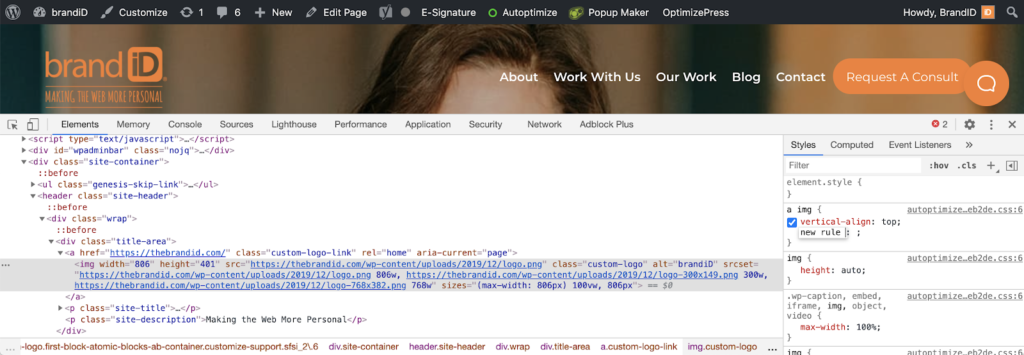
To see a particular element on your page, hover on it and right click into the Elements panel. You should then see the html code highlighted in the Elements panel with an additional Styles accordion displayed next to it.
In the styles accordion you’ll see which styles are applied to an element and from which line of css they originate. To change an existing rule, double click on the rule. To add a different rule, click to the right of the last rule added and type away.
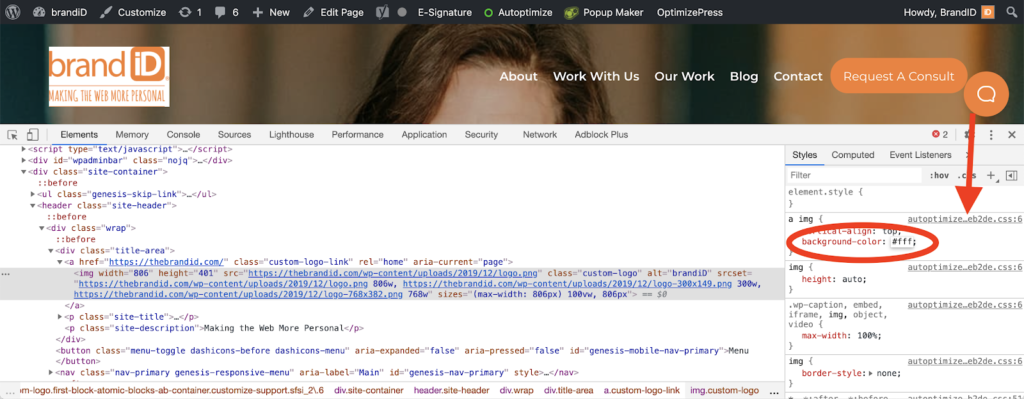
In this example, I’ve inspected my logo and changed the background color from orange to white (#fff). The new css rule is circled in red, and the arrow is pointing to the pathway where the line of code originates:
It’s important to note that changing the CSS in the Elements panel only affects the web page as you see it. The changes are not updated on the site unless you change the code using the site files or the Additional CSS tab (see this article on how to use the customizer ‘Additional CSS’ tab).
Why would you want to only temporarily make code changes to your website? It’s a great way to diagnose problems or test solutions / style changes before implementing them into the code live on the site.
Other handy inspector tips
- You can disable rules by hovering over them and unchecking the blue checkbox to the left of the rule.
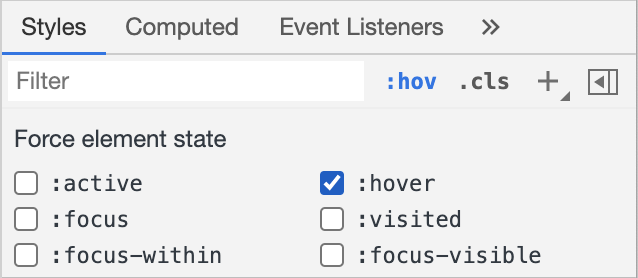
- Check the hover state of an element by clicking :hov at the top of the styles accordion:
Troubleshooting JavaScript issues
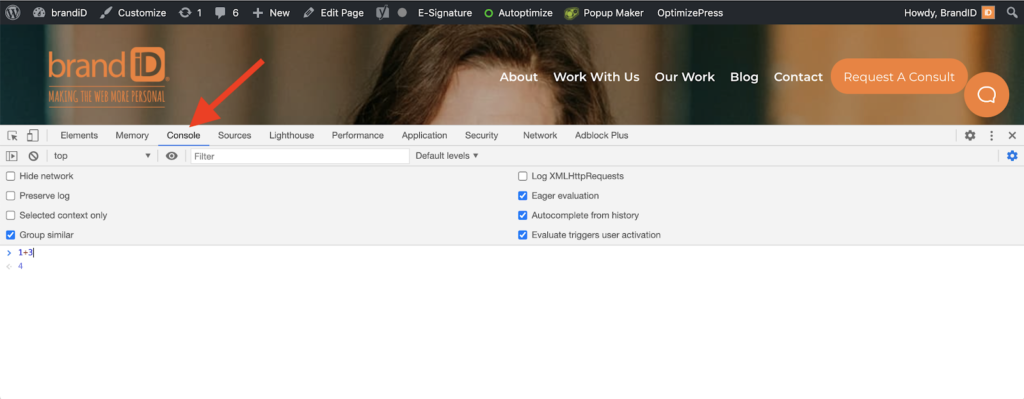
Finally, you can troubleshoot JavaScript issues by checking the Console. You can find this option in the top tab of the web developer tools labeled Console. There you will see logged messages and have the ability to run JavaScript. In the below screenshot, a simple JS command (1+3) returns a value of 4: